Why Not Better Profit? – Week of 8/5/22

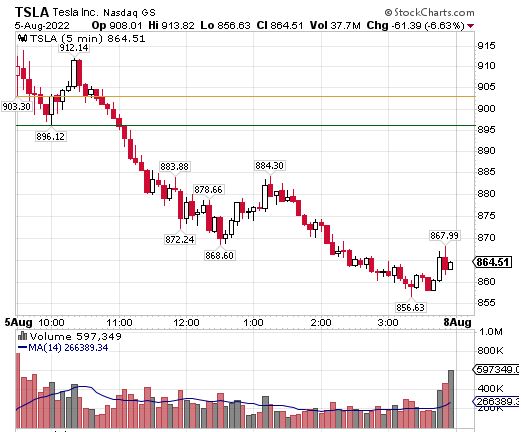
On Friday morning, the market gapped down after jobs numbers were released. This put most stocks back to the middle of their ranges, not giving any immediate set ups for open. TSLA had been on a 200 point run the last couple of weeks, so it would be one to look for a short if the market was going to remain weak for the day.

My top watch was COIN. I was looking for trade below Thursday's low at 86.78, which coincided closely with the pre-market low. This would give it a chance to fill the gap from Wednesday to 82.25. COIN put in an opening range low of 86.52, before running up to 98.87 over the next 45 minutes. I scalped around this, never allowing it to confirm the opening range low. The first entry was a trade just to take a trade, in anticipation of a break below the opening range low, and ended up being a loser. After a few more scalps, I was essentially break-even, and had spent a bunch of mental capital taking these lesser trades. At that point, I decided that the day was going to be a wasted day, and just watched the rest of the day.

Meanwhile, TSLA tested the 903 pivot from the low on Wednesday, putting in a low of 896.12 30 minutes after open, before printing its first green candle at the top of the new hour.

On the first candle of the next hour, TSLA made a new low of 895.09, with proper entry the very next candle on the break below. TSLA never saw above 895 the rest of the day, putting in a low of 856.63.

TSLA 5 Minute Chart 8/5/22

I did not take this trade, because I had already burned my mental capital for the day taking a trade on anticipation, before it confirmed, and then scalping to get back to break even.

One Good Trade – Week of 5/20/22

Entry and exits of QQQ Trade on May 19, 2022.

Wednesday, May 18 saw the markets break down again after threatening to move higher the previous day. We've seen the market try this several times in recent months, only to be rejected and start a leg lower. Wednesday evening, the question was posed as to what the market might do the next day. I decided to take a look at the chart, and saw similar breakdowns as recently as 5/5 and 5/11.

QQQ Chart after 5/18/22

Here, I have circled the daily candle of the day after each breakdown, 5/6 and 5/12. Both days saw a gap down, printing wicks at least as big as the body, with the close ending very near the open. I surmised we may see something similar for 5/19.

QQQ 5 Minute Chart 05/05-05/06
QQQ 5 Minute Chart 05/11-05/12

Premarket trading on 5/19 showed that we were indeed heading for a gap down. I decided to drill into the 5 minute charts for 5/6 and 5/12. I noticed that each day saw 10-25 minutes of selling, before 60-90 minutes climbing back to the afternoon area of resistance the previous day, at which a fairly sharp selloff occurred.

On 5/18, the afternoon resistance was 292-293, so I decided that I would enter a short at 292.

QQQ 5 Minute Chart 05/18-05/19

The pattern was a bit different, with buying occurring immediately, and hitting 292 within the first 10 minutes of the day. I took the short here, and a furious selloff occurred in the subsequent 10 minutes. I took off 1/4 of the position just above 290, and another 1/4 just above 288. Realizing that it was likely to be a choppy day, and the selling appeared to be running into buyers, I decided to cover the rest of the position. This ended up being a good choice; 287.58 held as the low of day.

Why Not Better Profit? – Week of 4/22/22

Last week, QQQ gapped down to start the the week, and stayed in a tight range between 338 and 348. It was an odd week, starting with the gap down on Monday and closing the day red, then Tuesday gapping up over Monday's high and selling off all day, then Wednesday straight up all day, and finally Thursday selling off all day. I told myself that I wasn't planning to take trades to the long side until we had a close over 348, outside of any strong stocks on obvious bounce days.

With this bias in mind, I ended the week with my highest profit total since the week before Thanksgiving.

So for this post, I want to highlight a trade I didn't take, but should have been all over on Friday. Thursday had QQQ finally close below the tight range we'd been in for a week and a half. This gave a green light to trade Friday with a strong sell bias.

QQQ Daily Chart before April 22, 2022

GOOGL tested 2500 and held several times since mid January, closing Thursday right at 2500 again.

GOOGL Daily Chart before April 22, 2022

GOOGL opened with a small gap up on Friday, allowing for an entry through Thursday's low at 2490, drifted lower all day, and did not even have a worthwhile bounce until the afternoon.

GOOGL 5 Minute Chart, April 22, 2022

This type of setup happens a handful of times per year, so it's a shame I decided to focus on a different ticker.