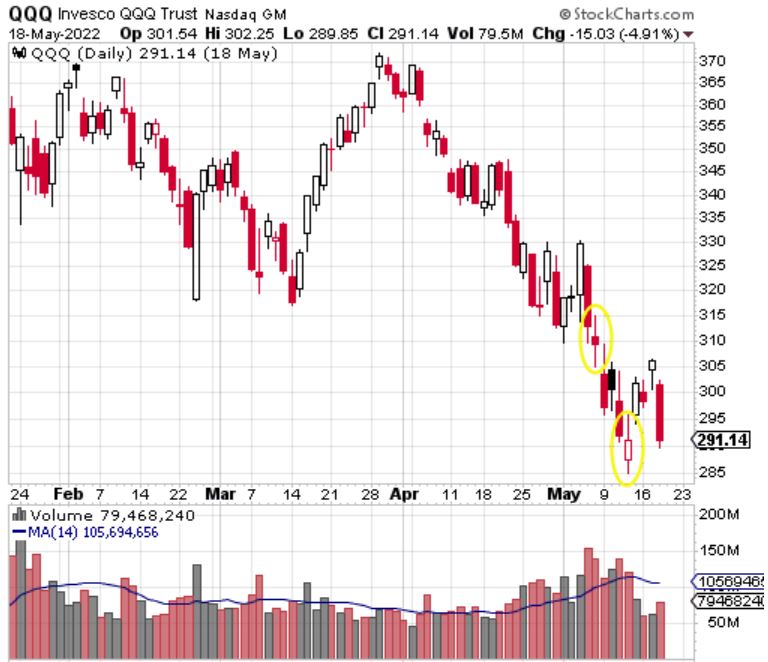
Wednesday, May 18 saw the markets break down again after threatening to move higher the previous day. We've seen the market try this several times in recent months, only to be rejected and start a leg lower. Wednesday evening, the question was posed as to what the market might do the next day. I decided to take a look at the chart, and saw similar breakdowns as recently as 5/5 and 5/11.

Here, I have circled the daily candle of the day after each breakdown, 5/6 and 5/12. Both days saw a gap down, printing wicks at least as big as the body, with the close ending very near the open. I surmised we may see something similar for 5/19.


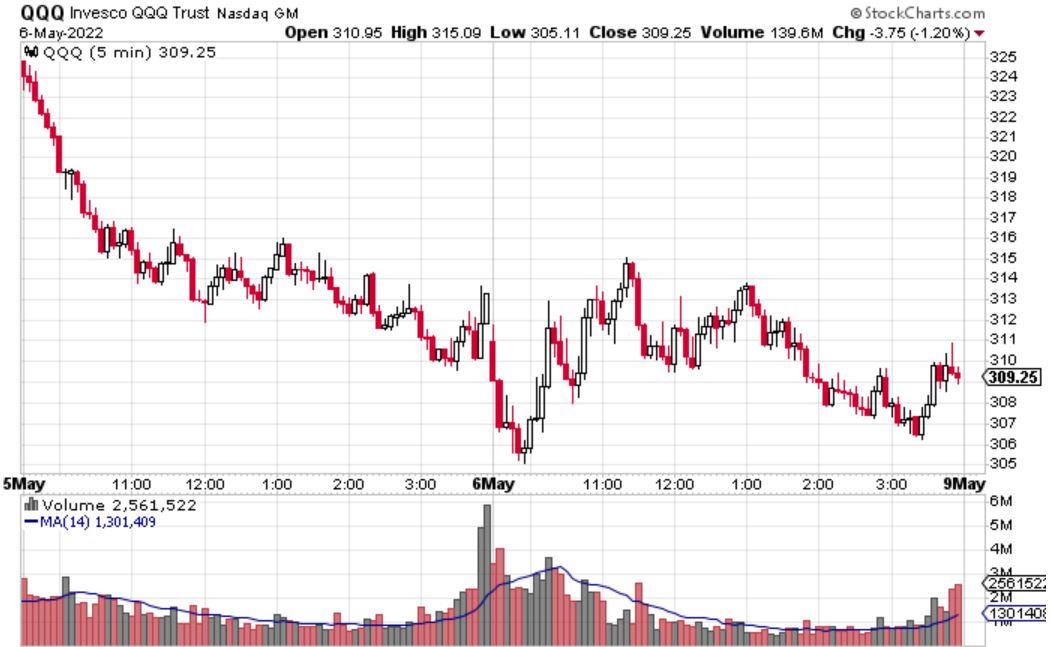
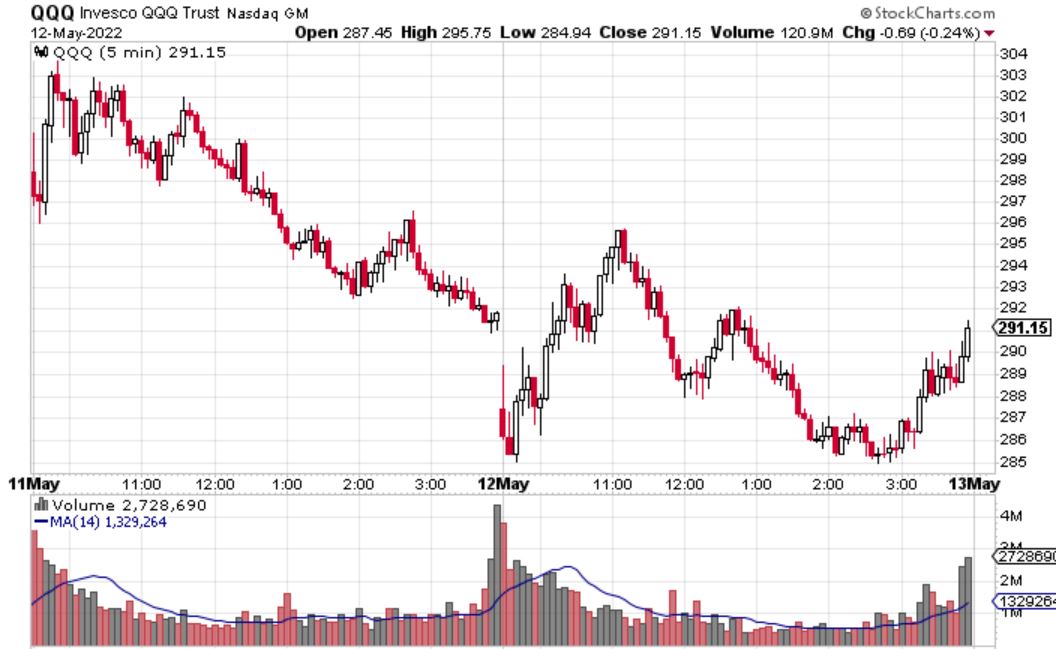
Premarket trading on 5/19 showed that we were indeed heading for a gap down. I decided to drill into the 5 minute charts for 5/6 and 5/12. I noticed that each day saw 10-25 minutes of selling, before 60-90 minutes climbing back to the afternoon area of resistance the previous day, at which a fairly sharp selloff occurred.
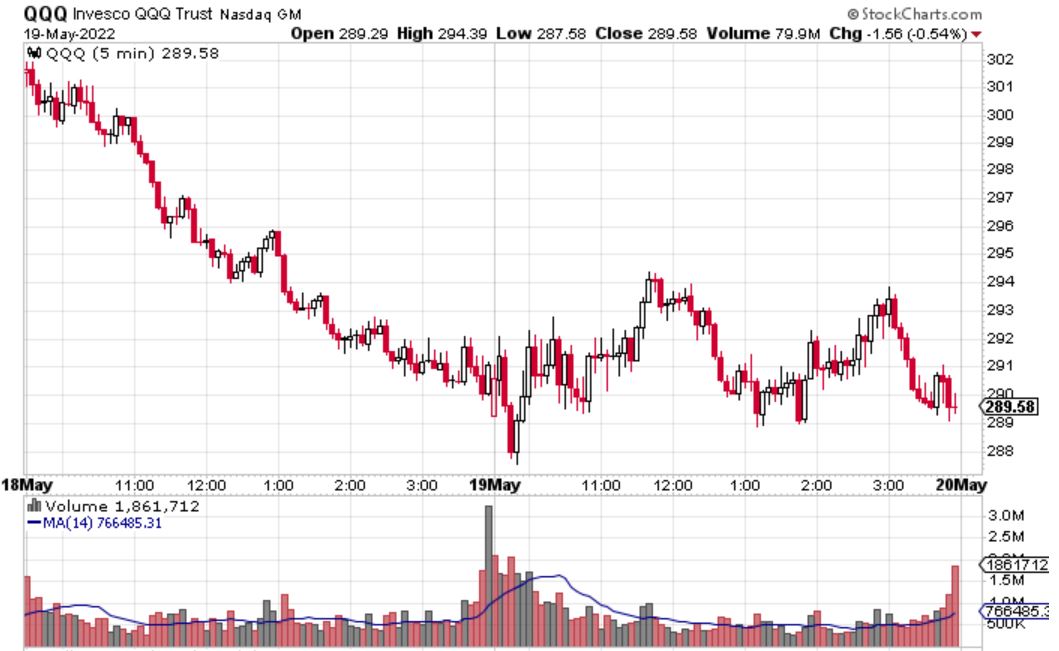
On 5/18, the afternoon resistance was 292-293, so I decided that I would enter a short at 292.

The pattern was a bit different, with buying occurring immediately, and hitting 292 within the first 10 minutes of the day. I took the short here, and a furious selloff occurred in the subsequent 10 minutes. I took off 1/4 of the position just above 290, and another 1/4 just above 288. Realizing that it was likely to be a choppy day, and the selling appeared to be running into buyers, I decided to cover the rest of the position. This ended up being a good choice; 287.58 held as the low of day.